Skysails will present their power curve at 10 am today. This is a public event and will be transmitted live online. Join here:
1 Like
You are invited to Press Event: SkySails Power – Airborne Wind Energy – From Germany to the World.
Press Event: SkySails Power
Fri, Mar 22, 10:00 AM - 11:00 AM (CET)
Experience a breakthrough in airborne wind energy with us: the world’s first externally validated power curve. This sets new standards in a highly innovative industry and you can be part of it.
We are especially looking forward to the speeches by Andreas Rieckhof, State Council of the Ministry for Economy and Innovation in Hamburg, and Joschka Knuth, State Secretary of the Ministry for Energy Transition, Climate Protection, Environment and Nature of the state of Schleswig-Holstein.
All the best,
Skysails Power GmbH
An Ereignis teilnehmen
Skysails Group GmbH Datenschutzrichtlinie
Dieses Ereignis wird von Microsoft Teams unter der Leitung des Besprechungsorganisators unterstützt. Die Datenverarbeitung, die zu Diesem Ereignis erfolgt, unterliegt den Bedingungen des Besprechungsorganisators. Microsoft Datenschutzrichtlinie
1 Like
For non-German speakers: Press the button An Ereignis teilnehmen or follow the MS Teams link in my first message.
Event is in German. Sorry, rest of the world:-(
Only the moderator was speaking German. Skysails in English;-)
You can activate the subtitles at the top right of the screen.
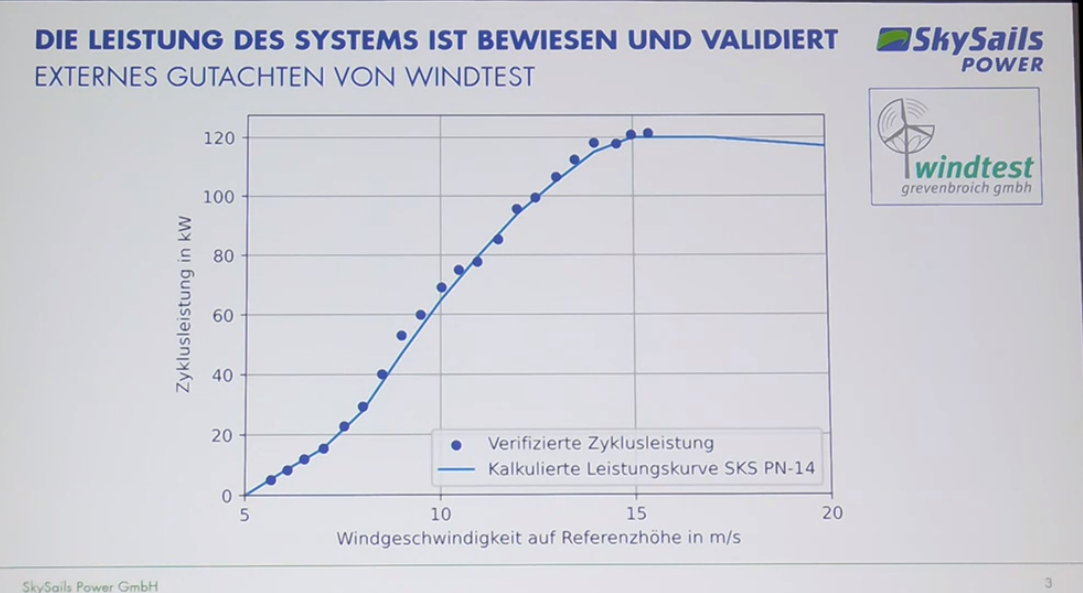
I remember seeing a power curve for a few moments. I don’t know if it was a predictive curve or relative to tests. This very regular curve seemed to rise to 120 kW for a wind speed of 15 m/s, if I remember correctly. Could it be the average power (tested or predicted?) over the full cycle?
The power curve was given by measured data points and an underlying curve resulting from their performance model. The breakthrough achievement is that the measurements were done by an independent company, Windtest. The procedure leading to this certified powercurve was explained to some detail.
4 Likes
Here is the English-language video that was screened

1 Like
This looks very interesting. But did they actually release a plot showing the power curve?
1 Like
Yes they showed the power curve.
But can we see it? it seems it was just made available to those in the meeting which is a bit odd. I guess eventually it will be available to the general public? Well, then maybe not, as even the traditional turbine makers dont release these even after decades
1 Like
You will find the power curve in this news release of Airborne Wind Europe.
Maybe this screenshot is better?
3 Likes
Do you/we know what the reference height is?
1 Like
This is indeed a breakthrough in wind power and should raise some eyebrows
Thank you @rschmehl.
This confirms what I thought I saw during the projection for a few seconds:
It is interesting to compare this curve with the curve shown in Figure 15 of the publication linked below.
Figure 15
Experimental results from a representative automated power cycle during flight tests at the SkySails Power site in northern Germany in spring 2021 […]. The average power over the pumping cycle is approximately 92 kW.
If the surface area of the kites and their characteristics are similar for these two tests approximately three years apart, we can then see that the average of 92 kW recorded with a wind of approximately 12 m/s could fall within the new curve. Thus these previous tests would also be validated according to the new criterion.
As for this current curve, I have the impression that it sags a little when the wind speed increases. Perhaps, as with conventional wind turbines, the nominal power is approached or even exceeded. Or it could maybe be due to another reason, perhaps linked to the type of performance of a flexible kite in crosswind flight.
At high wind speeds, perhaps they have to dial back on crosswind velocity to limit bridle or tether tension.
It was not mentioned but I heard that the reference height is the pattern height.
2 Likes
This would be a big difference from the wind speed measurement at mast height as indicated in figure 15 (link also above). An excerpt on 4.1.1.:
A specific measuring campaign achieved an uninterrupted automated flight of 42 h that featured day and night flight with an average power production of 62 kW, in wind conditions varying between 4 and 13 m/s (1-min average measured at a height of 10 m) and estimated wind speeds at flight altitude of 6–19 m/s, showing the robustness of the implemented flight and power cycle automation algorithms and all system components at relevant load conditions.
Also a discussion on Real efficiency of "Crosswind Kite Power" measured at the kite height?.
Its true. So this means that the curve point at 15 m/s would be maybe 10 m/s at 10 m altitude.
Seems to me traditional wind give power curves at the hub height and AWE seems to be using pattern height. This means that AWE could be at a disadvantage as for the same power output because the pattern height would be higher than hub height for similar power rating. I think this is of less concern at 10-15 MW that HAWT is capable of today is still far away (if possible) for AWE.
Also just giving hub altitude or pattern height makes the power curve chart most precise for any turbine.
I think the next step is coupling the power curve with the wind resouce at a certain location. Only after doing that you can compare the AWE plant to a HAWT plant.
You could compare for a standardised wind gradient, but in the end, you need to repeat the process for each site, so Im
not sure if it is very useful.