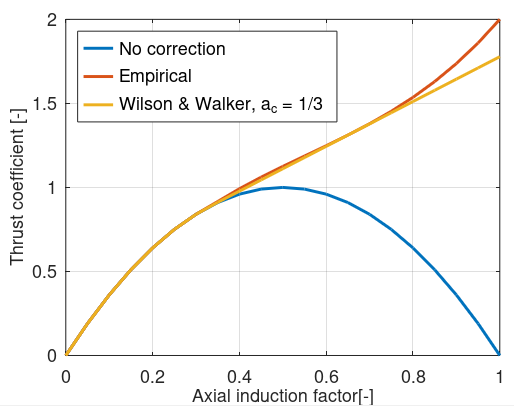
Well, it is true they didn’t mention how a parachutal drag Cd (aka Ct in HAWT) of 2.0 was measured, I tend to believe it is correct, because predicted Ct for axial induction factors greater than 0.5 will not fit the theory of nice laminar flowing wind turbines - as in figure 5 in the overly mentioned paper.pdf When the so-called axial induction factor exceeds values of 0.5 empirical data confirms that Ct gradually increases towards 2 instead of dropping to 0.
Here-s how actual thrust goes vs. charted from Betz numerical derivation:
The reason Betz computed thrust coefficient failes above 0.5 value of axial induction factor is that leads to negative wind speed downwind, which is impossible
As I indicated, the document intiled The Betz limit applied to Airborne Wind Energy brilliantly demonstrated the 4/27 limit for the reeling mode (also called yo-yo, or “lift” to use their terminology) in crosswind flight, compared to the 16/27 (Betz limit) applied to wind turbines, and also AWES in “drag” mode (which also implies crosswind flight but in fly-gen mode). The latter would then be the winner in terms of density (power-to-space ratio). But I asked some questions about crosswind flight that could apply to both “lift” and “drag” modes.
Now, let’s transpose this towards two non-crosswind systems, such as those presented on AWE in China: a parachute system in yo-yo mode, and a blimp carrying wind turbines. The 16/27 Betz limit could apply to the latter, while the 4/27 limit would apply to the parachute system. In a real world, the two systems will not reach their respective limits. See, for example this evaluation.
But if we look at the photos of the blimp carrying the wind turbines, with a total diameter of 40 meters, a quick calculation shows that the total wind area captured by the turbines represents only a small fraction of the total diametrical surface area, because the two sections of the airship occupy a considerably larger space. The two functions (aerostatic lift and turbine support) take up a significant amount of room, while the entire parachute-like flying system is dedicated to power generation.
Therefore, it’s not so easy to make a definitive judgment, to take this example.